Introduction
China is a big producer of oxygen sensors (oxygen saturation probe) and oxygen monitor. There are hundreds of enterprises involved in production and operation. However, many data show that most enterprises do not know much about the accuracy and detection methods of oxygen sensors. Our company has been researching and producing oxygen related products for nearly twenty years, and has a good understanding of its accuracy and measurement methods.
I. Research and development of oxygen sensor
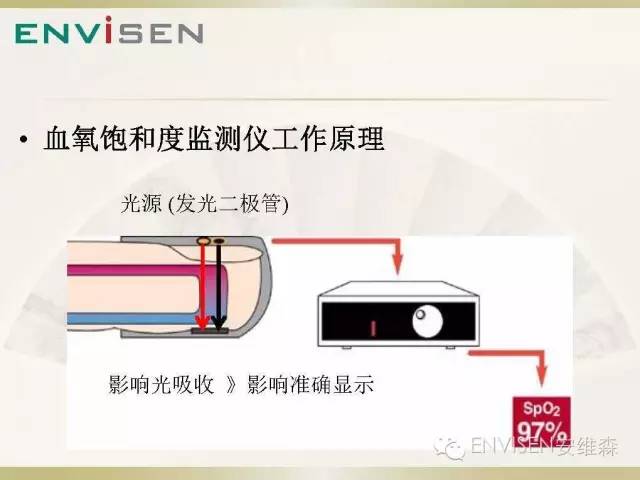
When it comes to the accuracy of blood oxygen, you should first understand the basic principles of oxygen. In fact, this is not complicated, mainly consists of two parts. The first part is a blood oxygen sensor, which collects light signals and converts them into electrical signals on the receiving tubes. The second part is the electronic instrument. The function is to change the electric signal according to the preset curve (R curve) to the corresponding blood oxygen value and display it on the screen.
Therefore, all factors that affect the intensity and total amount of optical signals will affect the accuracy of measurement!
Whether the R curve matches with the sensor, whether accurate or not, also directly affects the blood oxygen readings!
Therefore, sensors and instruments have an impact on the accuracy of the readings!
2. classification of oxygen sensors
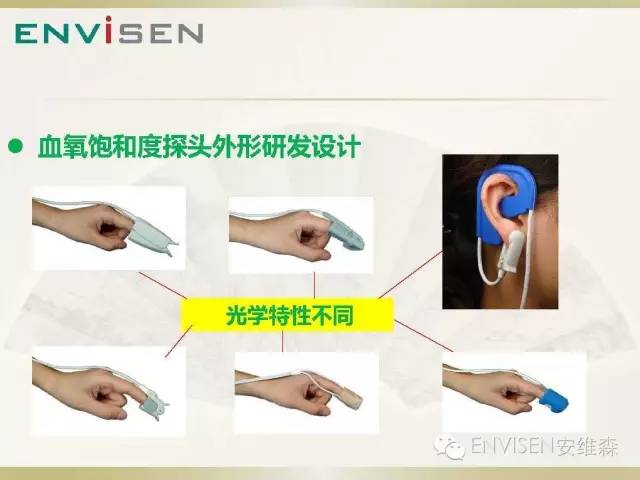
The types of blood oxygen sensors are designed for various types and styles. General blood oxygen instruments are equipped with two types of repeatability and disposable repeatability sensors. Repeatability of the sensor used in large, medium and little finger clip sensor, and the little finger sensor, Y type, package type and ear clip type and forehead reflection etc.. Commonly used disposable adult, children, infants and newborns and other styles, materials may be cloth, foam, sponge and so on. The optical characteristics of each sensor designed by different structures are different. Under the same conditions, the number of light received by each sensor is different.
3. factors affecting the accuracy of oxygen sensors
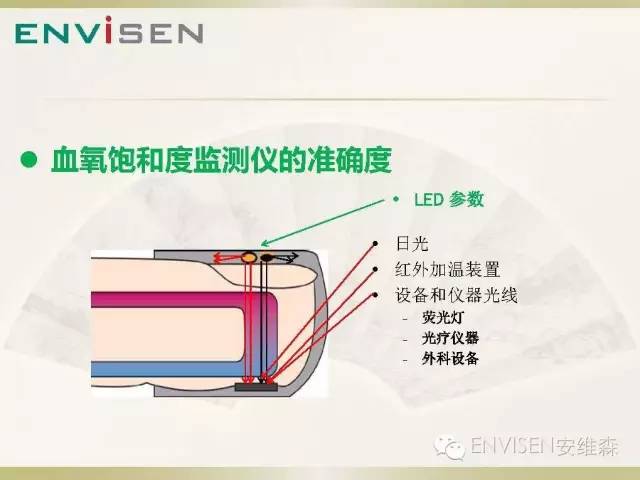
There are many factors that affect the reception of light by the oxygen sensor receiving tube:
1) the parameters of the tube: the absorption curve of arterial blood to red light and infrared light is different. The light wave is different, the power is different, under the same condition, it can penetrate the cortex of the tested part, the blood vessel, the muscle tissue reaches the receiving pipe, the quantity of light is different.
2) the parameters of the receiver tube: the size of the receiving tube, the sensitivity is different, the ability to receive light is different. Generally speaking, the receiving tube has large area and can receive more light, less area and less receiving.
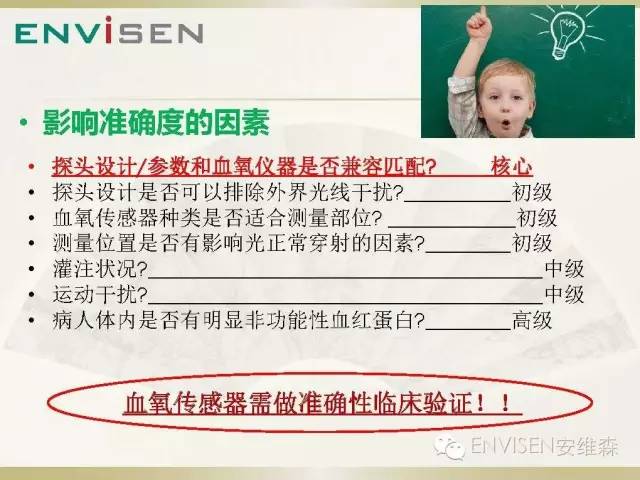
3) sensor design: different sensor design, interference light resistance ability is different.
4) the composition of the sensor material: different sensor materials, light absorption and interference is different.
Therefore, the parameters and design of different sensors have different effects on light, and each sensor has unique optical characteristics!
Making and adjusting of 4.R curve

According to Beer-Lambert's law, the relationship between the ratio of red light and infrared light R/IR and arterial oxygen saturation (SaO2) should be linear. But because of the complexity of the optical properties of biological tissues, the correlation curves (referred to as R curves, the same below) can only be determined by experimental methods.
That is to say, R curves should be adjusted for each sensor! Or say, each sensor has its own R curve. NELLCOR OXIMAX technology, such as sensors, there are 10-15 models, each with chips, which stored more than a dozen oxygen curve. When inserted into the instrument, the instrument automatically identifies and uses the corresponding R curve in the measurement.
The R curve making and tuning process varies from company to company, but basically consists of the following three steps:
1) establish the basic R curve of the sensor, you can use the blood oxygen simulator. But the simulator can not simulate the absorption mode of the blood to the light under hypoxia. (Note: the US FDA has asked the instrument to be renamed as a functional test instrument)
2) adjusting the R curve by means of building a hypoxic environment and using standard instruments.
3) finally in the standard oxygen laboratory by ISO 80601-2-61 (YY-0784) blood gas comparison test.
This process may be repeated several times, until the development of sensor and oximetry in a certain environment and condition of the displayed value and the results of blood gas analysis in the allowable error.
双语对照
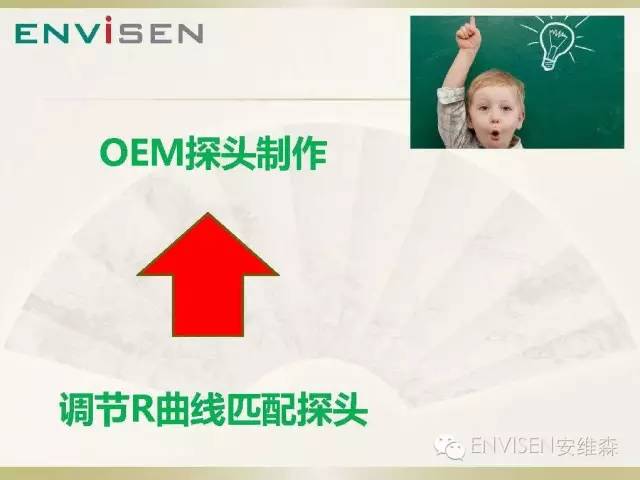
This is how OEM sensors and R curves are made and validated. If there is an error, engineers usually reduce the error by adjusting the R curve. So OEM sensors are relatively easy to make. The sensor manufacturing technology requirements are not high. This factory can be adjusted by the R curve complement accuracy defect. Of course, once the R curve has been adjusted, the sensor design and parameters used for calibration are the original sensors and must be controlled and sealed. You may not change at will. If you have to change, you must proofread the curve from scratch! Therefore, the international OEM manufacturers generally do not arbitrarily change sensor design and parameters. More and more domestic manufacturers are beginning to realize this problem, and actively seek the production system complete and perfect factory foundry, no longer because of the price reasons to change sensor design.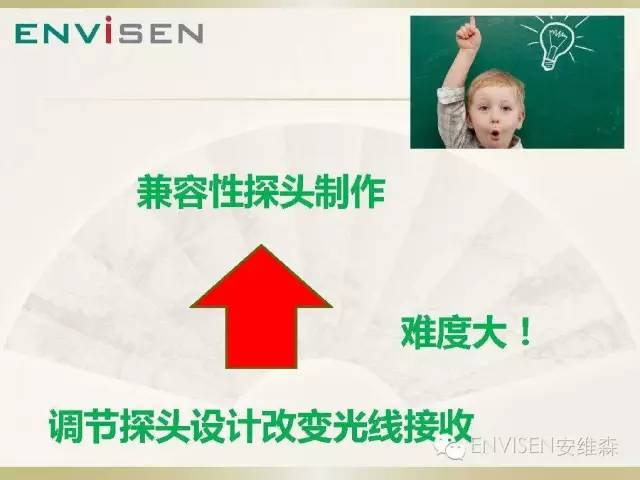
So, what about compatibility sensor development? Because the instrument is not its own, you can not change the design of the R curve. This can only be adjusted by the sensor design and parameters, in order to adjust the sensor to, in the same conditions, the total amount of light on the receiver tube is similar to or similar to the original sensor. This can be compatible with the R curve set in the instrument. But since there are too many factors affecting the sensor's light, it is difficult to accurately adjust the amount of light received by the receiving tube. Especially the instrument manufacturers do not open the R curve and the parameters of the sensor, nor to the real-time sensor manufacturers notice compatibility instrument design and R curve changes, sensor manufacturers can only pay close attention to the compatibility of the equipment manufacturers to detect timing compatibility every act and every move. It requires manpower, resources and technology. This is more difficult than making OEM sensors! At present, most manufacturers of compatible sensors do not actually have this capability.
5. standard for oxygen sensors
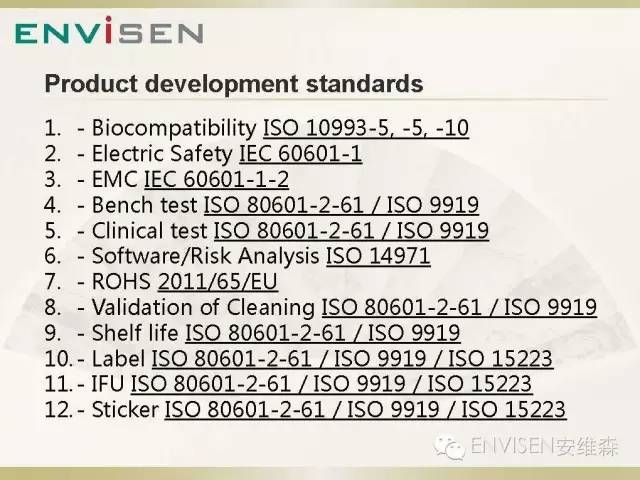
The sensor is well designed and the R curve is well adjusted. The blood oxygen sensor is only half done. The above standards must be satisfied at least. Only through the above standards of testing are passed, an electronic product can be considered to be reborn into medical products! At present, most sensors designed and manufactured oxygen sensors are still at the level of electronic products. It has not yet been converted to medical equipment. The reason is that there are no relevant tests. If the oxygen sensor is developed and tested according to the above standards, an average model costs about 1-2 yuan. But most companies are now developing oxygen sensors, and each model costs just $100-200. Such products have great technical and security risks.
Two. Test of oxygen sensor
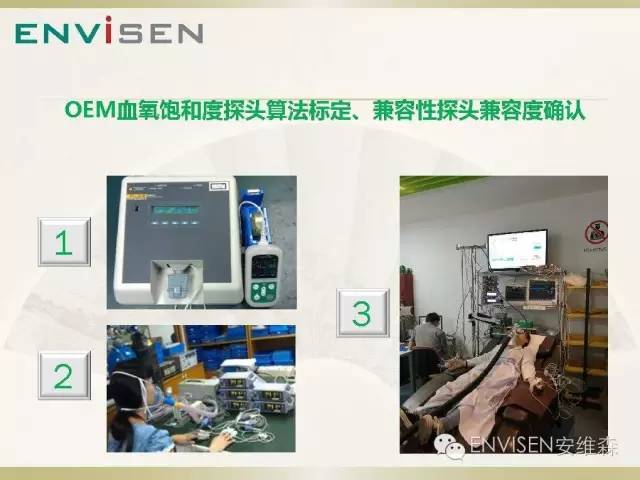
1. how to perform the blood oxygen sensor test

How do you measure the accuracy and accuracy of the blood oxygen sensor and oximeter? This is actually very simple! It is necessary to perform clinical tests in the standard oxygen laboratory established according to the relevant regulations of the ISO80601-2-61! There are four internationally recognized standard oxygen test laboratories, 3 in the United States and 1 in europe. But the most active and best known is the Dr. Bickler laboratory at the University of California, San Francisco. All of the world's largest brands of blood oxygen instruments have been tested in this laboratory. The lab was also founded by Dr. Severinghaus, the founder of the standard oxygen laboratory. Dr.Severinghaus retired from the lab by Dr. Bickler, President of the current international association for the blood. After half a year of communication and preparation, Professor Ye Jilun and Ann wiesen in 2012 Professor SZU and Bicker with the establishment of the Joint Laboratory of Shenzhen University. This is a standard oxygen testing laboratory, and the standards and procedures for testing are fully in accordance with the current standards and procedures of the University of California. All hardware and software are provided by the Bickler laboratory at the University of California. It's the first laboratory in asia. Since its inception, it has made product verification for more than 50 companies in more than 10 countries worldwide. The experimental report was signed by Professor Bickler and recognized by the European and American countries.
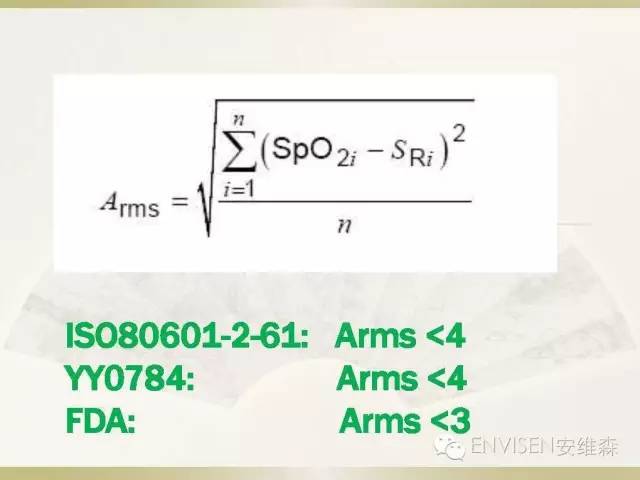
The accuracy of the blood oxygen product is expressed by the root mean square RMS of the difference between the instrument and the standard blood gas readings. International standards and Chinese standards require that the RMS of the sensor in the 70%-100% range must be less than 4; the US FDA standard is 70%-100%, and the RMS of the range must be less than 10.
2. compatibility blood oxygen sensor contrast experiment

Thanks to the construction of the standard lab, I did several interesting experiments and comparisons to further validate our understanding of the accuracy of the OEM blood oxygen sensor and the compatible oximeter. The first set of experiments is to select three repetitive sensors in an HandyOxi handheld brand new oxygen test instrument. The R curves of the three sensors in this instrument are specially tuned, and the curves of each sensor are different. The identification chip of the curve is embedded in the sensor. Connected to the instrument, the instrument identifies the type of sensor and the corresponding R curve is removed. Therefore, these three sensors can be said to be the original sensor of the palm type instrument.
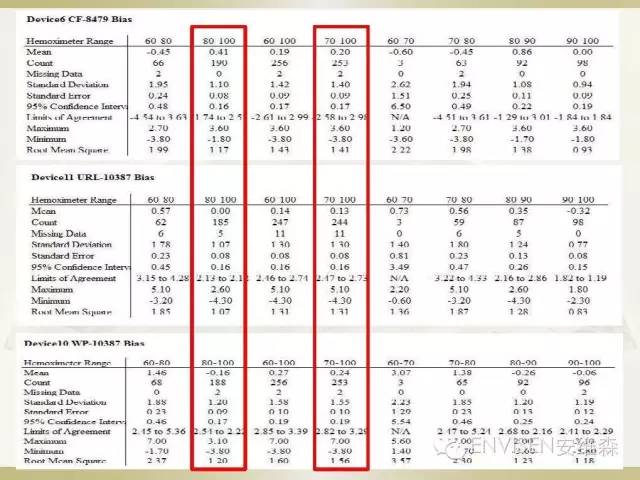
From the results of the test, we can see that the RMS in the interval 70%-100% is all less than 1.55. in the 80%-100% interval, all RMS is less than 1.2., and the accuracy of the international blood oxygen brand is the same! Therefore, OEM sensors, we have a large domestic experts, can do very well! Believe that our domestic engineers in understanding the theory of blood oxygen and verification methods, R curves can be crafted, to achieve world-class standards.
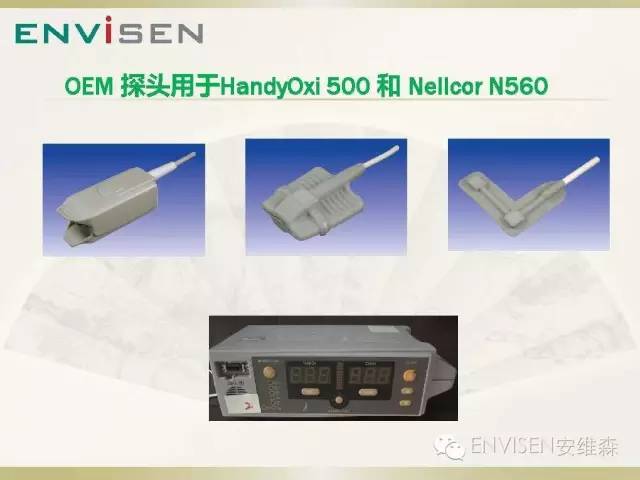
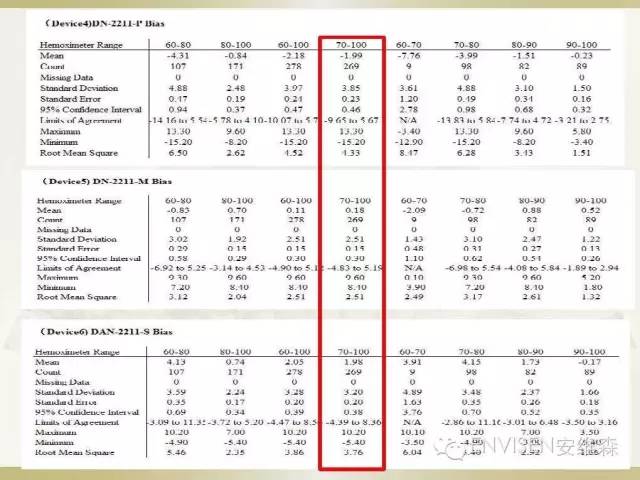
The second part of the experiment also uses the same three sensors and connects them to the three NellcorN560.
The R curve R curve and NELLCOR security module close oxygen company vision. Its blood oxygen module was directly involved in the research and development of Mike Bernstein, a former NELLCOR research and development manager. Is it possible to say that the R curve of HandyOxi is the R curve of NELLCOR?
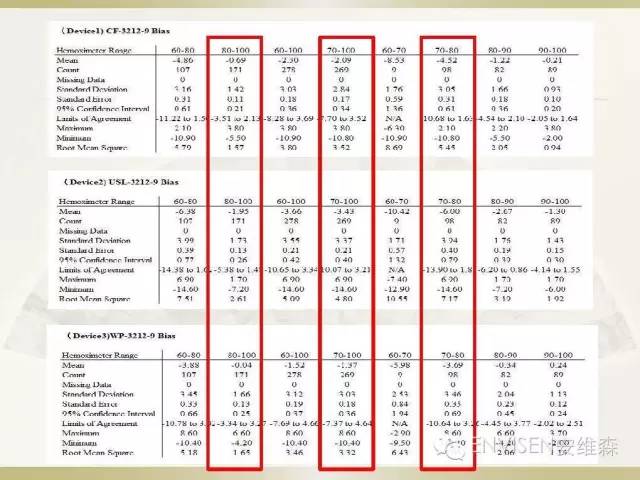
The experimental results can be seen in the 80%-100% blood oxygen range, although the RMS values are in line with the ISO standard and the US FDA requirement. But the readings on the 70%-80% range vary greatly. The RMS value that directly leads to the 70-100% range exceeds the FDA requirement in the United states. So, in accordance with the relevant standards, the three sensors are not compatible with Nellcor instruments. Therefore, the R curve of HandyOxi is not the NELLCOR curve of R, and other markets call NELLCOR technology products. The oxygen meter believes there is also the accuracy problem.
What's the matter? It's clear in the standard laboratory.

The above experimental results verify a fact. A sensor that performs well on a brand does not equal good performance on another brand of equipment. Therefore, a sensor is not compatible with all or a plurality of different R curve oximeter!
For example, MINDRAY sensor for baolaite or Edan or PHILPS instrument is not compatible, and vice versa!

The second set of experiments was designed to examine the differences in the accuracy of the sensors between the structure and the material.
Our first experiment took three finger, finger sensor, and the sensor package, three sensors and test parts of the contact are silica gel material. But the structural design is not the same. The experiments were carried out on the Nellcor N560 instrument. It can be said that except for the structure, all the other conditions are the same.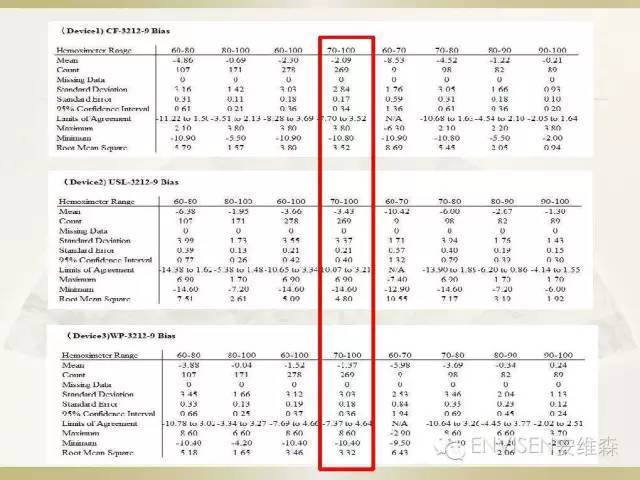
Apart from compatibility and accuracy issues. From the experimental data, it can be seen that the readings of the three sensors are different. This difference should be caused by structural differences. But the finger sensor and parcel sensor data are similar, indicating that the absorption curve of the clip sensor and parcel sensor is similar. We think that the size of the silica gel should be proportional to the amount of light absorption. So the silicone finger sensor area, which has a light absorbing area is larger, the maximum deviation of the test results. The other two sensors have similar silica gel area, and the results are similar. This inference requires more experimental data to support it.

The second experiment is to explore the difference of the same structure and different materials in the blood oxygen test.
We use fabrics, materials, foam materials, sponges, respectively, with the same structure of disposable sensors. The sensor performs a blood gas contrast test on Nellcor N560. All conditions are the same except for the sensor material.
Apart from the compatibility issue, it can be seen from the experimental results that the three sensors with the same structure behave differently under the same Nellcor curve. However, due to the fact that the experimental data is too small, we can not find the regularity of the error caused by different materials. But this experiment further proves that the difference between the materials does affect the accuracy of the sensors.
Three. Conclusion

I explained the results of several experiments, and I can summarize the following three points.
ØO the blood oxygen sensor has a specific R curve
ØChanging the design parameters of the sensor is equivalent to changing the R curve!
ØThe product needs to be verified by clinical experiments!
So, in general, the biggest reason for the accuracy of the blood oxygen sensor is actually the compatibility of the sensor and the curve! As for other designs, types, designs, and comfort improvements, they are not a problem for Chinese engineers. Many domestic companies have started the research and development of ultra low perfusion and anti motion interference sensors and instruments. It is believed that in the near future, China will also have engineers who can overcome the challenge of using non-invasive methods to detect nonfunctional hemoglobin in the human body.
China is the world's fastest growing country for blood oxygen monitoring! China has an unrivalled manufacturing base! By vigorously popularizing the common sense of blood oxygen, we should guide enterprises to scientifically and professionally develop blood oxygen products, and strictly control the quality of blood oxygen products, and the Chinese blood oxygen manufacturing industry will surely go to the world!
This is a copyright declaration [] Ann wiesen original articles, the use of text, images and content information, copyright is an all new, any media, websites or individuals without authorization, shall not be reproduced, links, reprint or copy / release published in other ways. Our company will be held responsible for the relevant laws!

绿色:创新、可持续;
红色:激情、生命力;
灰色:沉稳、务实性;

For more fun and collaboration, please scan for "ENVISEN"
Copyright:Shenzhen Whaley Electronics Technology Co., Ltd Computer version | Mobile Edition